Why Weekly Reports Eat Your Best Hours
Marketing automation saves an average of 6+ hours a week on routine tasks. Report creation ranks second among the most-automated marketing tasks, right behind customer profiling.
Yet most freelancers and agency staff still build client reports by hand every Monday. Screenshot from Google Analytics, screenshot from Ads Manager, screenshot from Search Console, paste into a Google Doc, add commentary, send.
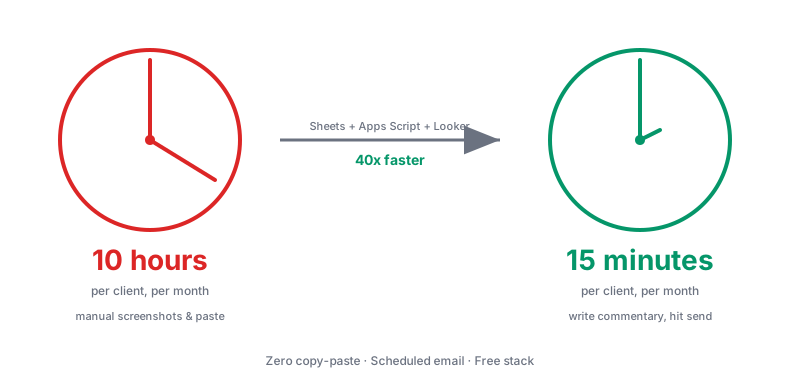
That workflow costs 10 hours a month per client. In one case study on my own site, that same job dropped to 15 minutes once automated.
This post is the exact build.
Chapter 1: The Stack You Will Use
Everything free. Everything Google-native.
Google Sheets holds the raw data.
Apps Script pulls data from APIs into Sheets on a schedule.
Looker Studio reads the Sheet and visualizes it.
Scheduled email delivery pushes the report to the client every Monday.
Total cost: $0. Total build time on the first client: under an hour.
Chapter 2: Step 1 — Structure the Source Sheet
Create a new Google Sheet. Name it after the client.
Create four tabs. Traffic, Conversions, Search, Notes.
Each tab needs a header row that matches what Apps Script will write. For the Traffic tab: Date, Sessions, Users, Bounce Rate, Avg Session Duration. For Conversions: Date, Conversions, Conversion Rate, Revenue. For Search: Date, Impressions, Clicks, Position. For Notes: Date, Author, Comment.
This structure matters because Looker Studio reads column names directly. Rename a column later and every chart breaks.
Chapter 3: Step 2 — Populate the Sheet
Three options depending on your technical comfort.
Option A: Manual paste weekly. Slowest but works. Export CSVs from GA4, Search Console, and Ads. Paste into the corresponding tabs. Set a Monday reminder.
Option B: Looker Studio native connectors. Skip the Sheet layer. Connect GA4, Search Console, and Ads directly to Looker Studio. Fastest to set up. Less flexible when the client adds a custom KPI.
Option C: Apps Script pulling APIs. Best long-term. Runs on schedule. Writes to Sheets. Looker Studio reads the Sheets. This is the option the case study on my site uses.
Pick Option C if you serve more than three clients. The setup pays back within a month.
Chapter 4: Step 3 — Sample Apps Script for GA4
Simplified version to get you started:
function pullGA4Data() {
  const SHEET_ID = 'YOUR_SHEET_ID';
  const PROPERTY_ID = 'YOUR_GA4_PROPERTY_ID';

  const request = {
    dateRanges: [{startDate: '7daysAgo', endDate: 'yesterday'}],
    dimensions: [{name: 'date'}],
    metrics: [
      {name: 'sessions'},
      {name: 'totalUsers'},
      {name: 'bounceRate'},
      {name: 'averageSessionDuration'}
    ]
  };

  const response = AnalyticsData.Properties.runReport(request, `properties/${PROPERTY_ID}`);
  const sheet = SpreadsheetApp.openById(SHEET_ID).getSheetByName('Traffic');

  response.rows.forEach(row => {
    sheet.appendRow([
      row.dimensionValues[0].value,
      row.metricValues[0].value,
      row.metricValues[1].value,
      row.metricValues[2].value,
      row.metricValues[3].value
    ]);
  });
}
Enable the Google Analytics Data API in Apps Script's Services panel before running.
Set a weekly time-driven trigger. The Sheet now updates itself every Monday morning.
Chapter 5: Step 4 — Connect Looker Studio
Open Looker Studio. Click Create, then Data source. Pick Google Sheets. Select the client sheet and pick the Traffic tab.
Repeat for the other three tabs.
You now have four data sources ready. Create a new report. Add the first data source. Drag the first chart.
Chapter 6: Step 5 — The Six Metrics That Actually Get Read
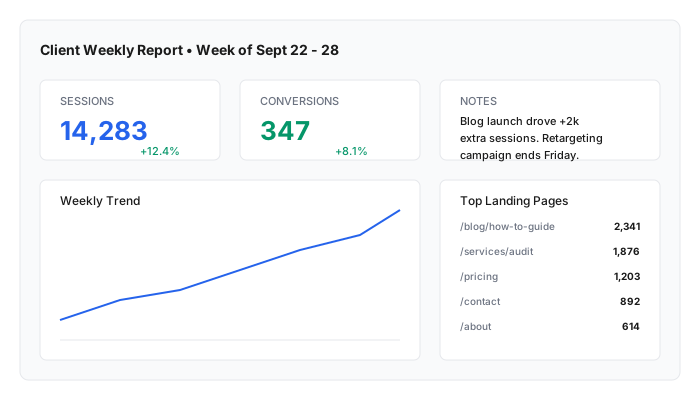
Most client reports have 25 metrics on page one. Client scans, sees noise, closes the tab.
The six that consistently earn attention:
- Sessions this week vs previous week
- Conversions this week vs previous week
- Top 5 landing pages by conversions
- Top 10 search queries by clicks
- One highlight chart (whatever moved most)
- One line of context from the account manager
Everything else lives on page two or gets cut. Ruthless focus is what separates a report that drives client meetings from one that sits unread.
Marketing automation delivers a 544% ROI over three years and cuts operational costs by 25-30%. Automated reporting is where those gains show up first because reports are recurring by definition.
Chapter 7: Step 6 — Design That Reads at a Glance
Three design rules that matter for a client report:
One color per metric type. Traffic in one color, conversions in another, revenue in a third. Consistent color coding trains the client's eye.
Numbers first, charts second. Scorecards at the top. Charts below. A client checking on their phone sees the number without scrolling.
White space beats density. Two charts per row on desktop, one per row on mobile. Looker Studio has a mobile toggle. Use it.
Chapter 8: Step 7 — Automate the Delivery
In Looker Studio, click the Share button, then Schedule delivery.
Set frequency to weekly. Set day to Monday. Set time to 8 AM in the client's timezone.
Add the client's email. Add your team's email. Save.
Every Monday morning, a PDF of the current report lands in the client's inbox with no human touching anything.
Chapter 9: Step 8 — The Commentary Layer
Automated reports need human context or they feel cold.
Add a text component at the top of the report. Update it every Friday with two or three lines of what happened this week. What went up, what went down, what to expect next week.
Looker Studio does not have a native commenting field, so this stays manual. Five minutes of writing per client per week keeps the report feeling like it came from a person.
Chapter 10: Common Failures and Fixes
The scheduled email did not send. Check that the Looker Studio owner has edit access to every data source. If you built the report on one account and moved it, the schedule breaks.
Numbers do not match Google Analytics. Looker Studio applies its own default date range and sampling. Set explicit date ranges on every chart and confirm the property matches.
Chart shows "Configuration incomplete." The dimension or metric got renamed at the Sheet level. Rebuild the chart or restore the column name.
Chapter 11: What This Unlocks
Once one client dashboard exists, the next one takes 20 minutes. Make a copy of the report in Looker Studio. Swap the data source connections. Update the client name.
At three clients, you have three hours a week back. At ten clients, you have a full workday.
Freelancers who nail this workflow typically raise their retainer within six months because the perceived quality of the reporting jumps while the delivery cost drops.
Chapter 12: When to Move Beyond Looker Studio
Looker Studio free hits limits at:
Five blended data sources per chart. Complex marketing stacks blow past this.
Ten million rows per Sheet source. Not usually a client-report problem.
No native alerting when a KPI drops. You get scheduled sends only.
For most freelancers and small agencies, none of these matter for years. When they do, Power BI or a paid analytics platform makes sense. Until then, Looker Studio wins on price and speed.
Commentary Section
Reach out to three agency owners or freelance consultants for the metric they refuse to leave off a client report. Candidates: agency LinkedIn creators, digital marketing coaches, and specialists who publish templates.
Their picks add credibility. The variety of picks shows readers there is no single right answer, which builds trust in your own recommendations.
Wrapping Up
Weekly client reports do not need to eat a full workday. A Google Sheet, an Apps Script, and Looker Studio replace the entire manual workflow for free. The first client takes an hour. Each additional one takes 20 minutes.
Related tutorials worth reading next: the Looker Studio calculated fields guide for KPIs the client actually asks for, the beginner's guide to Apps Script triggers for scheduling data pulls, and the guide to setting up your first data pipeline for when Looker Studio hits its ceiling.
Sources: