Why Calculated Fields Are the Real Power of Looker Studio
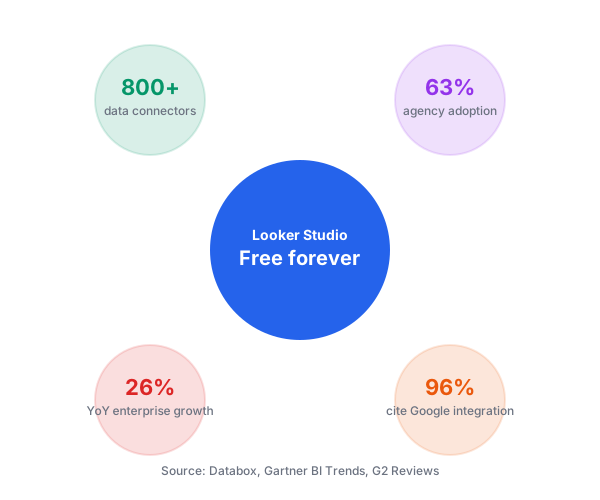
Looker Studio is free. It connects to over 800 data sources. Enterprise adoption grew 26% between 2023 and 2024, and 63% of marketing agencies use it as their primary reporting tool.
The base product is powerful. Calculated fields are what separate a dashboard that looks pretty from one that answers actual business questions.
Most marketers never build one. This guide changes that.
Chapter 1: What Is a Calculated Field
A calculated field is a new column that only exists inside Looker Studio. The underlying data source stays untouched. The field lives in the report.
Two flavors exist. A dimension-type calculated field returns text or a category. A metric-type calculated field returns a number you can sum, average, or count.
You create either one by clicking Add a field at the bottom of the data panel in your report.
Chapter 2: The Function Library
Looker Studio supports over 70 functions across four families.
| Function family | What it does | Common examples |
|---|---|---|
| Aggregation | Roll up values | SUM, AVG, COUNT, COUNT_DISTINCT |
| Arithmetic | Math operations | +, -, *, /, ROUND |
| Text | Manipulate strings | CONCAT, LOWER, REGEXP_MATCH |
| Conditional | Branching logic | CASE, IF, NARY_MAX |
Most useful marketing fields live in the conditional family. That is where CASE lives, and CASE handles 70% of real work.
Chapter 3: Calculated Field 1 — Conversion Rate
Every report needs this one.
Conversions / Sessions
Add it as a metric. Set the format to Percent. You now have a live conversion rate that updates when the date range changes.
This one field saves you from adding a manual percentage column to every source spreadsheet.
Chapter 4: Calculated Field 2 — Traffic Channel Grouping
Raw source data comes in messy. Google, google, google.com, google/cpc. All the same channel to a human, all different rows to Looker Studio.
Group them with CASE:
CASE
  WHEN REGEXP_MATCH(Source, ".*google.*") THEN "Google"
  WHEN REGEXP_MATCH(Source, ".*facebook.*|.*fb.*") THEN "Facebook"
  WHEN REGEXP_MATCH(Source, ".*linkedin.*") THEN "LinkedIn"
  WHEN Source = "(direct)" THEN "Direct"
  ELSE "Other"
END
Add it as a dimension. Now your traffic charts show four clean channels instead of forty inconsistent ones.
Chapter 5: Calculated Field 3 — Custom Date Ranges
Compare current quarter to previous with a single dimension.
CASE
  WHEN Date >= DATE(2026,7,1) AND Date <= DATE(2026,9,30) THEN "Q3 2026"
  WHEN Date >= DATE(2026,4,1) AND Date <= DATE(2026,6,30) THEN "Q2 2026"
  ELSE "Other"
END
Set it as a dimension and add it to a bar chart. Instant quarter-over-quarter view.
Chapter 6: Calculated Field 4 — Weighted Metrics
Sometimes an average lies. A blended average of 100 sessions at 5% conversion and 10 sessions at 50% conversion is not 27.5%. It is 9%.
Force the weighted math with a metric field:
SUM(Conversions) / SUM(Sessions)
That one substitution fixes a category of reporting errors that trip up even senior analysts.
According to CRM data quality research, 76 percent of organizations report that less than half of their data is accurate and complete. Weighted metrics catch aggregation errors that hide inside otherwise clean data.
Chapter 7: Calculated Field 5 — Revenue Per Session
Revenue / Sessions
Add it as a metric. Set the format to Currency.
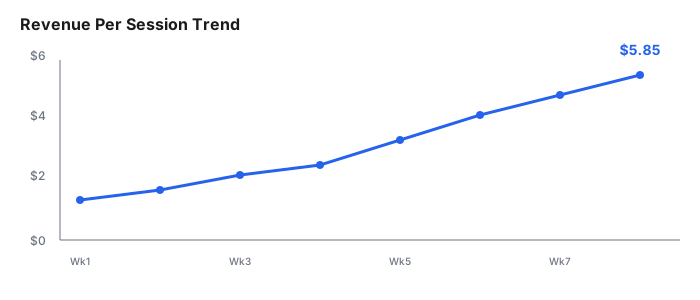
Pair it with a scorecard component that shows the month-over-month change. Marketing leadership loves this metric because it captures both traffic quality and monetization in one number.
Chapter 8: Calculated Fields 6 to 8 — The Text Cleaners
6. Standardize campaign names to lowercase:
LOWER(Campaign)
7. Extract country from a locale field like "en-US" or "fr-FR":
REGEXP_EXTRACT(Locale, "-([A-Z]{2})")
8. Combine first and last name into full name:
CONCAT(FirstName, " ", LastName)
Text cleaning inside Looker Studio prevents recurring cleanup work in the source Sheet or CRM.
Chapter 9: Calculated Field 9 — The Bucket Field
Group continuous values into ranges. Session duration is the classic case.
CASE
  WHEN Session_Duration < 30 THEN "Bounce"
  WHEN Session_Duration < 120 THEN "Short"
  WHEN Session_Duration < 300 THEN "Medium"
  ELSE "Engaged"
END
Set it as a dimension. Chart your traffic by engagement bucket. This is one of the fastest ways to make a session data chart tell a story.
Chapter 10: Calculated Field 10 — The Data Freshness Flag
Show the reader when a data point is stale.
CASE
  WHEN DATE_DIFF(TODAY(), Last_Updated) > 7 THEN "Stale"
  WHEN DATE_DIFF(TODAY(), Last_Updated) > 3 THEN "Aging"
  ELSE "Fresh"
END
Use it as a color dimension on a table. Green rows are fresh, yellow aging, red stale. Executive readers spot data trust issues in one glance.
Chapter 11: Common Errors and Fixes
"Invalid formula" on a working formula. Looker Studio treats capitalization strictly for function names. sum fails. SUM works.
Field reference errors after reconnecting a data source. Field IDs change when you disconnect and reconnect. Rebuild the calculated field or rename the source field to match.
Nothing shows on the chart. Check that the field type matches. A calculated dimension cannot go into a metric slot and vice versa.
Chapter 12: The One Big Limitation
Calculated fields inside Looker Studio Free do not support ROW-LEVEL operations across blended sources. Blend limits stop at 5 sources.
For marketing dashboards that stitch GA4, Google Ads, LinkedIn Ads, and Facebook Ads, that ceiling arrives fast. When you hit it, the workaround is to blend and clean in Google Sheets first via QUERY, then connect the cleaned Sheet to Looker Studio.
Commentary Section
Reach out to three Looker Studio experts for a favorite calculated field they use every week. Candidates: Google Product Experts in the Looker Studio community, analytics agency owners, and Databox or Whatagraph reviewers.
Their formulas plus a headshot give the post third-party credibility. Their names give the post ten warm outreach targets when you promote it later.
Wrapping Up
Ten calculated fields cover most marketing dashboard needs. Start with conversion rate and channel grouping. Add the rest as your reports mature.
Related tutorials worth reading next: the QUERY function guide for prepping data before it reaches Looker Studio, the beginner's guide to Apps Script triggers for auto-refreshing your source Sheets, and the setup guide for weekly reports covering date range filters and scheduled email delivery.
Sources: